Skip to content
Building a better South

Building a better South

The Center for a Better South

  • About us
    • Our successes
    • Our people
  • Photos
    • See the site’s best photos
    • Alabama photos
    • Georgia photos
    • N.C. photos
    • S.C. photos
    • Virginia photos
    • Meet our photographers
  • Videos
    • SC Promise Zone (2016)
    • Promoting opportunity (2013)
    • A five-year retrospective (2011)
    • Meet the Center (2008)
  • News
  • Publications
    • Ideas for a Better Gulf
    • Tax reform: “Do Better”
    • Environmental policy: “Getting Greener”
    • Agenda for a Better South
  • Donate today!
  • Contact
Posted on April 25, 2013October 28, 2013 by Andy Brack

Election, 2012

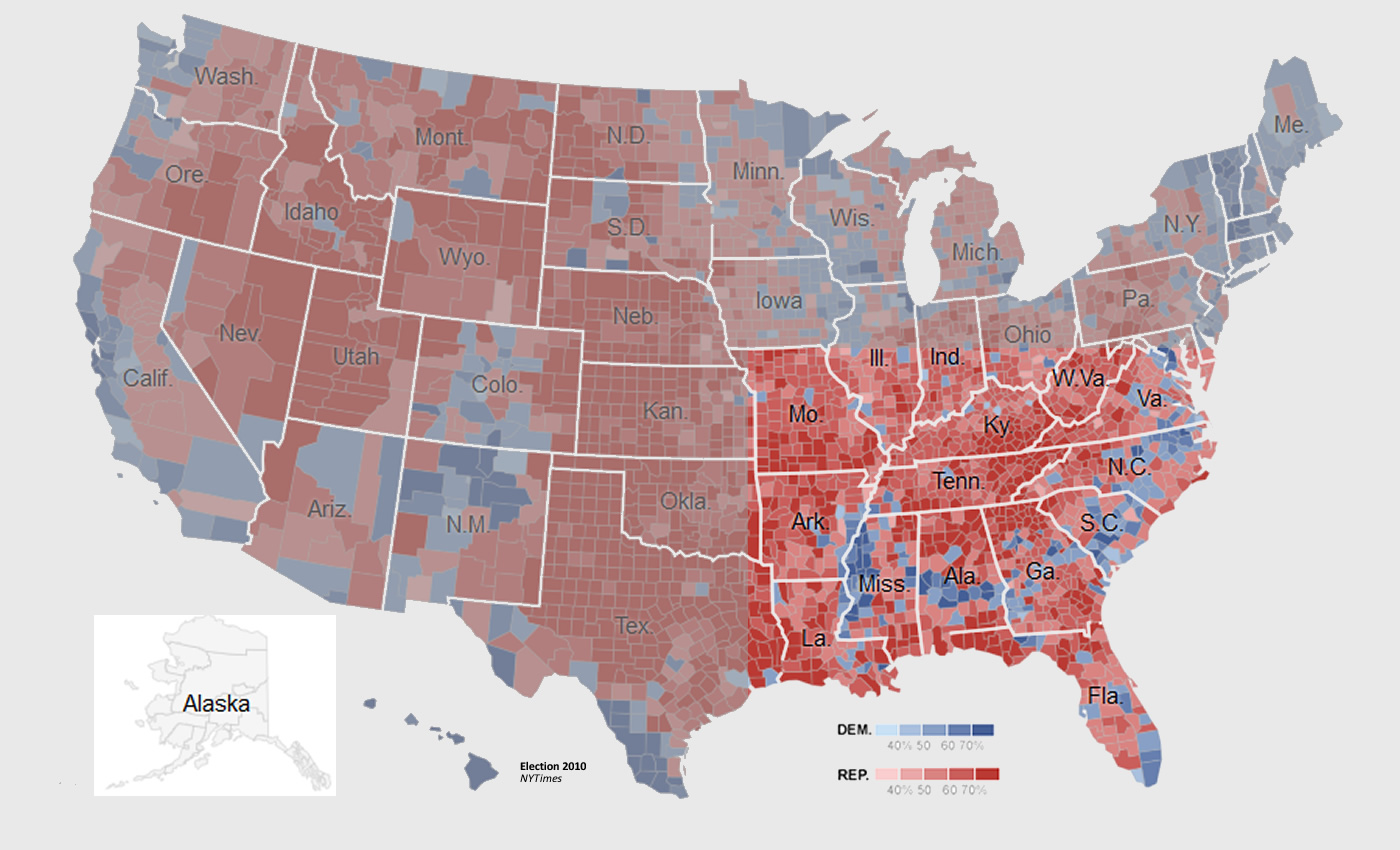
Results of the 2012 presidential election 

The more blue the county, the higher percentage of Democratic vote.  The more red the county, the higher percentage of Republican vote.

Source:  The New York Times. (click the “county” icon on left)

12_election_updated


  • Read more about the 2012 presidential election results by county in Wikipedia; click to see a similar map.
CategoriesMaps Tags2012, election

Post navigation

Previous PostPrevious Slavery, 1860
Next PostNext Population, 2010

Donate

Stay connected

See the video


Or click this link to see the movie.

Archives

Center for a Better South

This institution is an equal opportunity provider and employer. Contact us.

Stay connected

Search

Proudly powered by WordPress