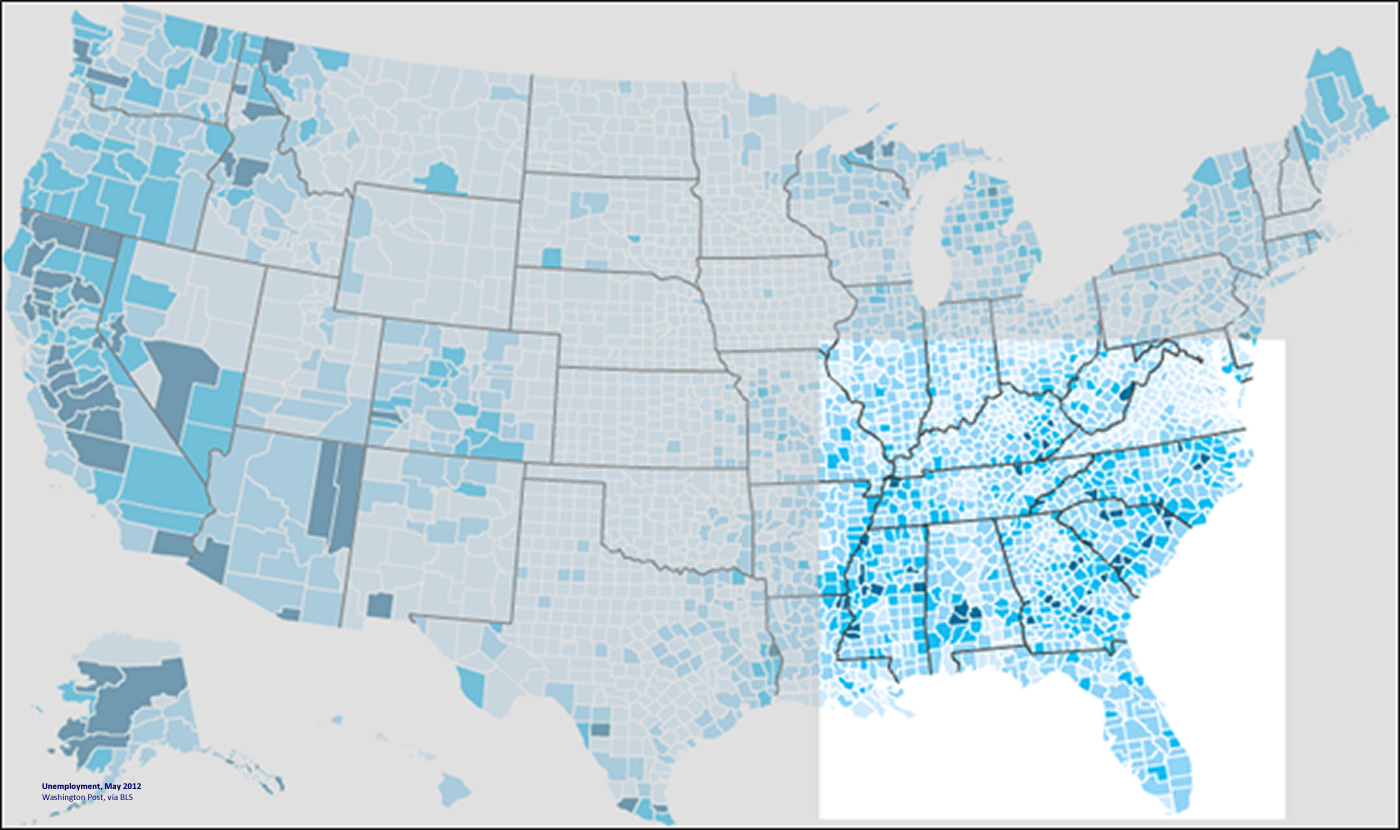
Unemployment, 2012
Source: Washington Post via Bureau of Labor Statistics data.
The darker blue, the higher the rate of unemployment in May 2012.

The Center for a Better South
Unemployment, 2012
Source: Washington Post via Bureau of Labor Statistics data.
The darker blue, the higher the rate of unemployment in May 2012.
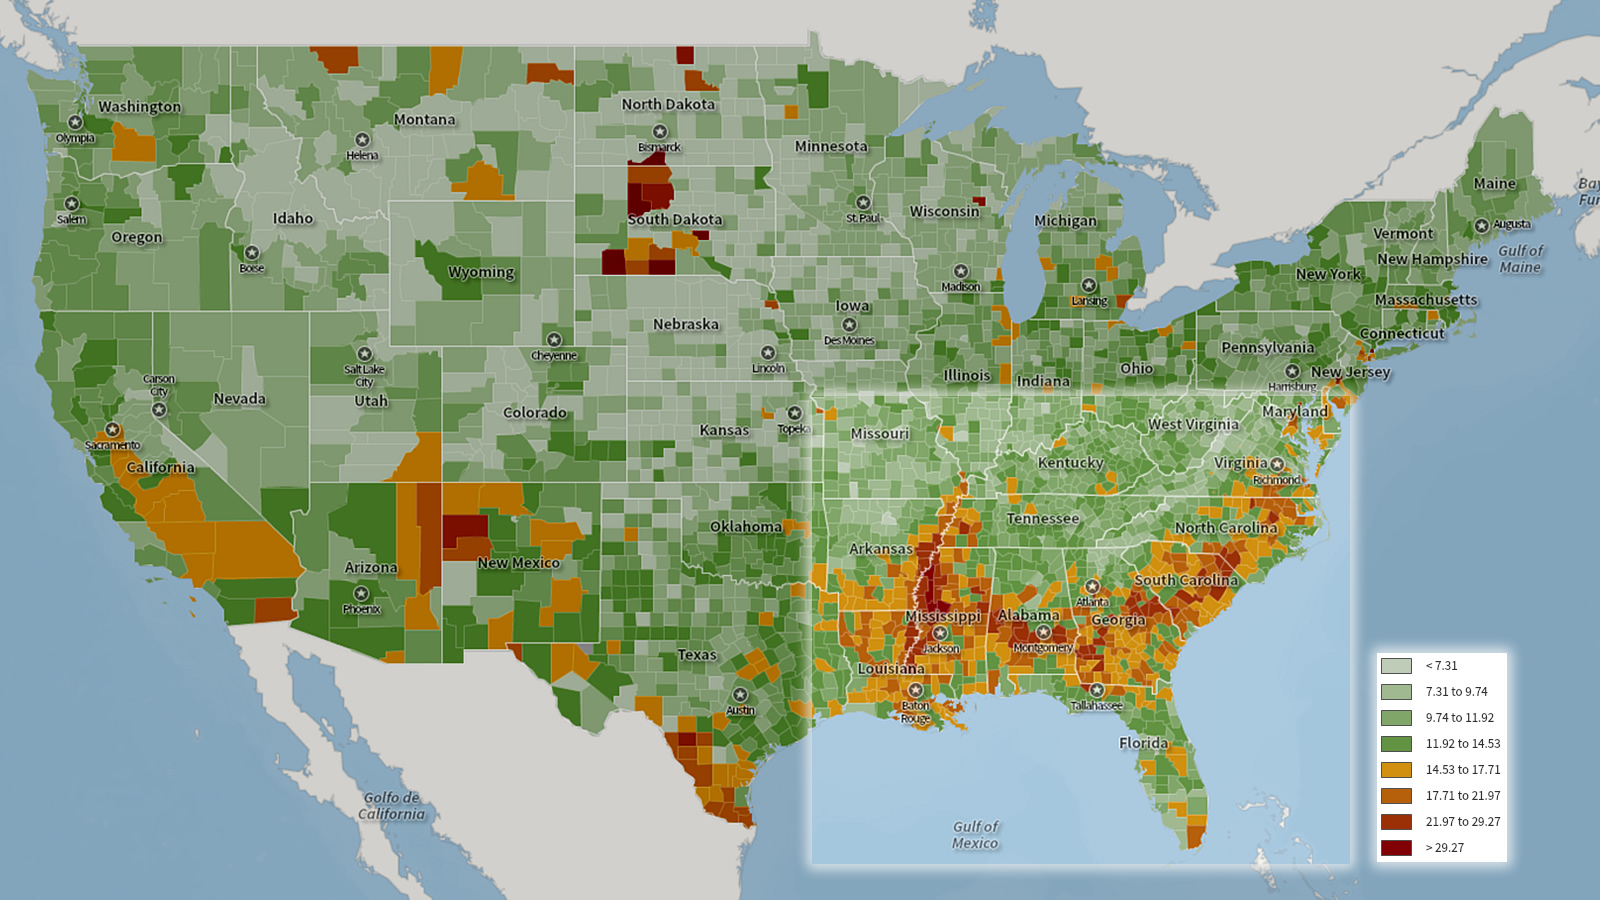
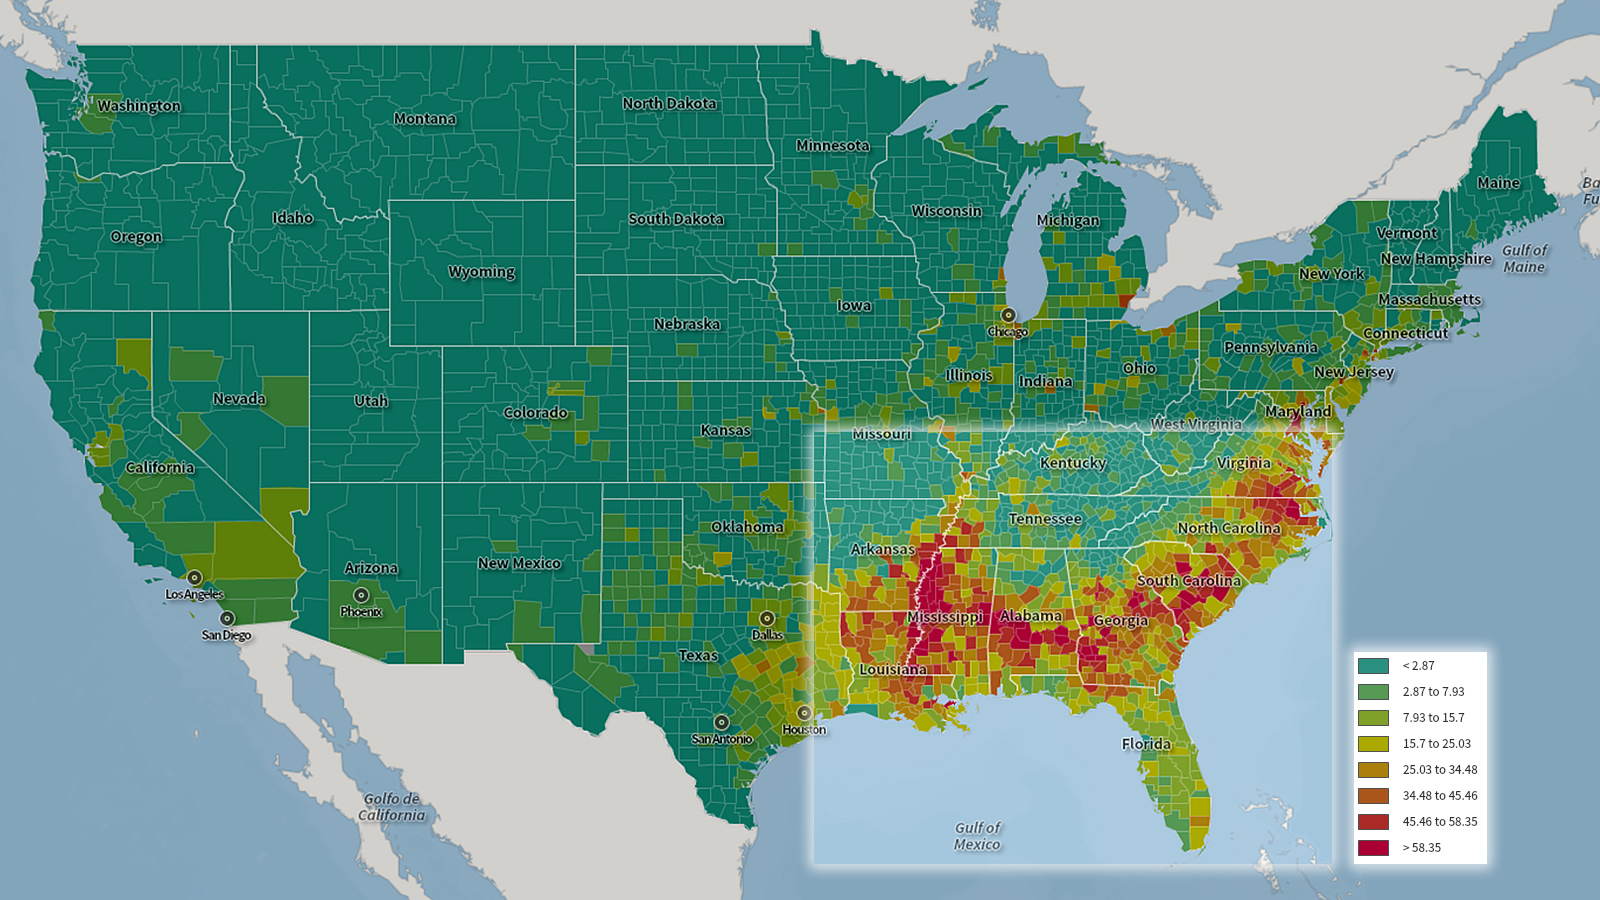
Female heads of household, 2010
Source: U.S. Census with image by Center for a Better South using SocialExplorer.com
Percentage of households with single women as the heads of households in the South (highlighted in the box) with the red and orange counties representing higher percentages.
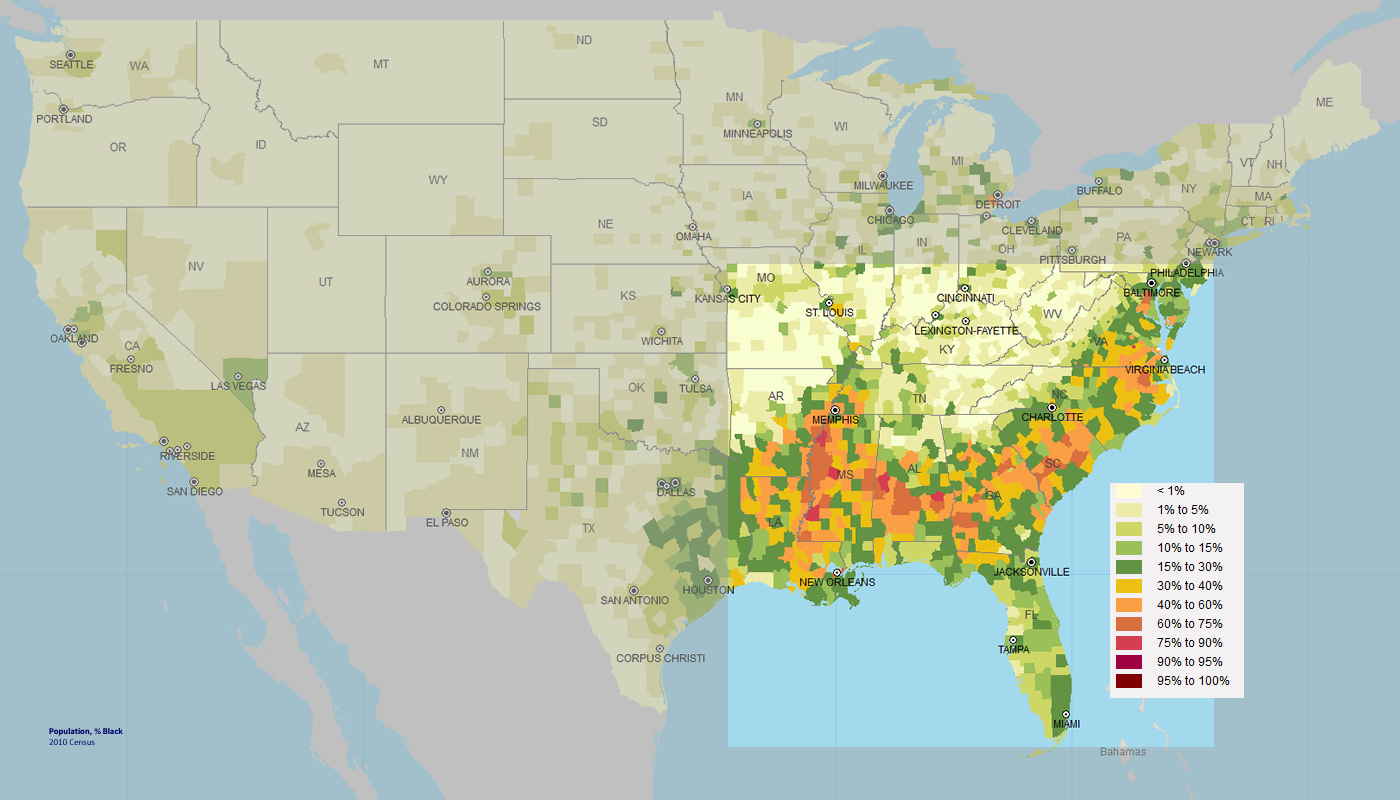
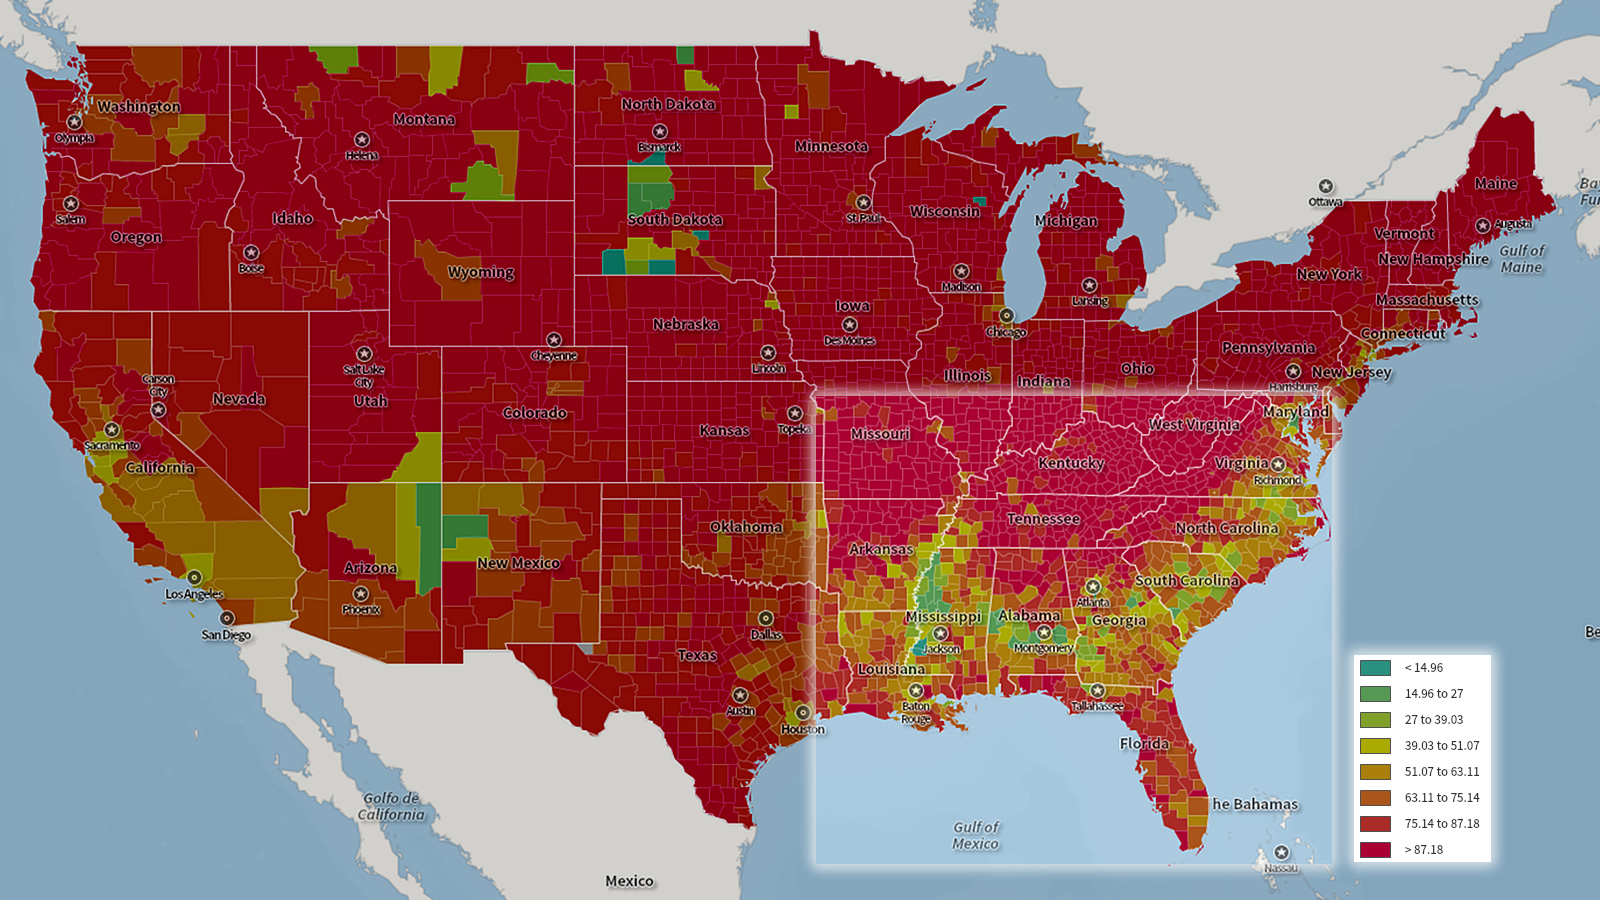
Population, 2010
Source: U.S. Census. Image by Center for a Better South using SocialExplorer.com.
There are two maps for population based on 2010 Census data: Percentage of white people and percentage of Black Americans.
Percentage of white population in the South with the darker red being higher percentages of whites.
Percentage of black population in the South with the orange and red being higher percentages of blacks.
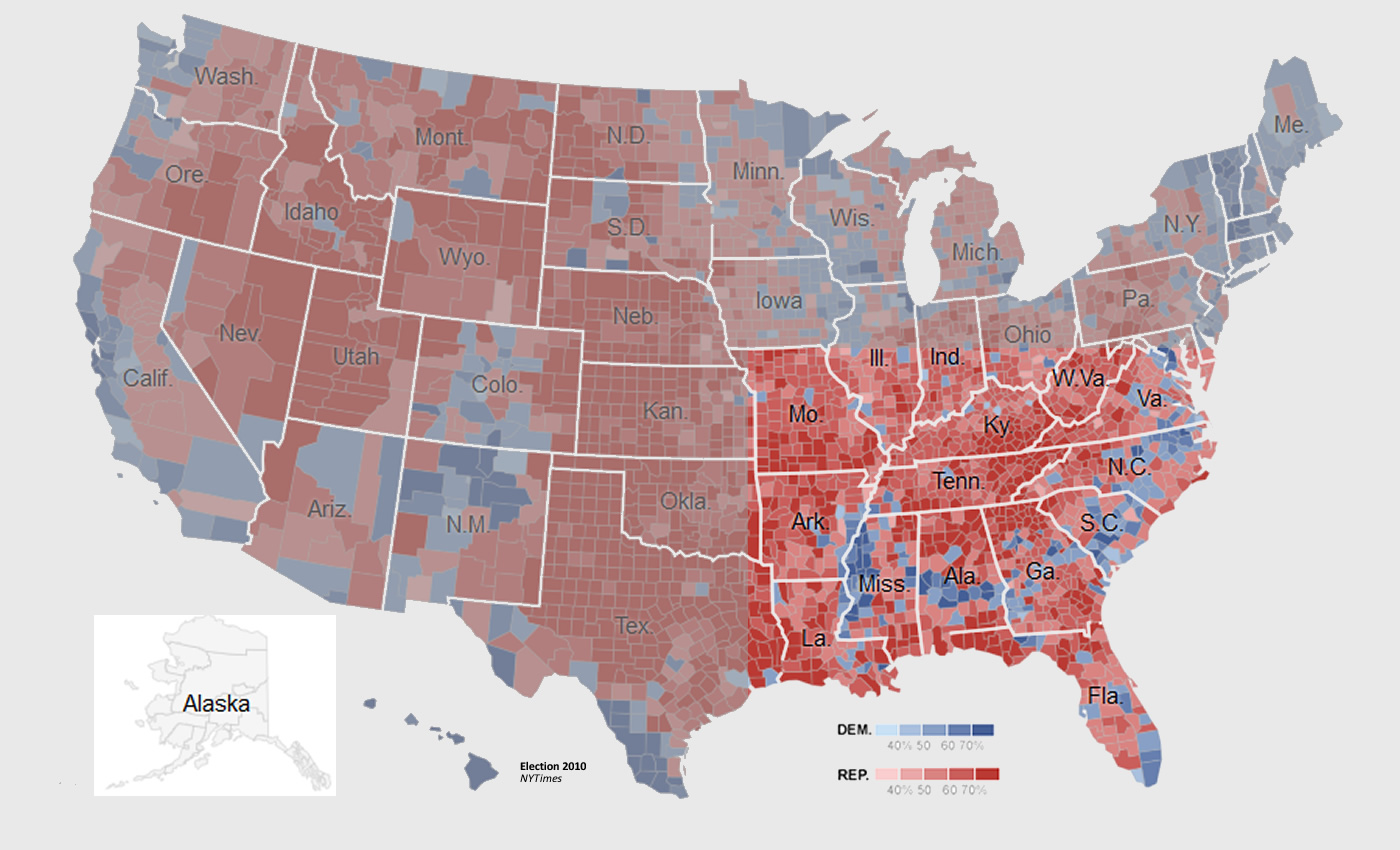
Results of the 2012 presidential election
The more blue the county, the higher percentage of Democratic vote. The more red the county, the higher percentage of Republican vote.
Source: The New York Times. (click the “county” icon on left)
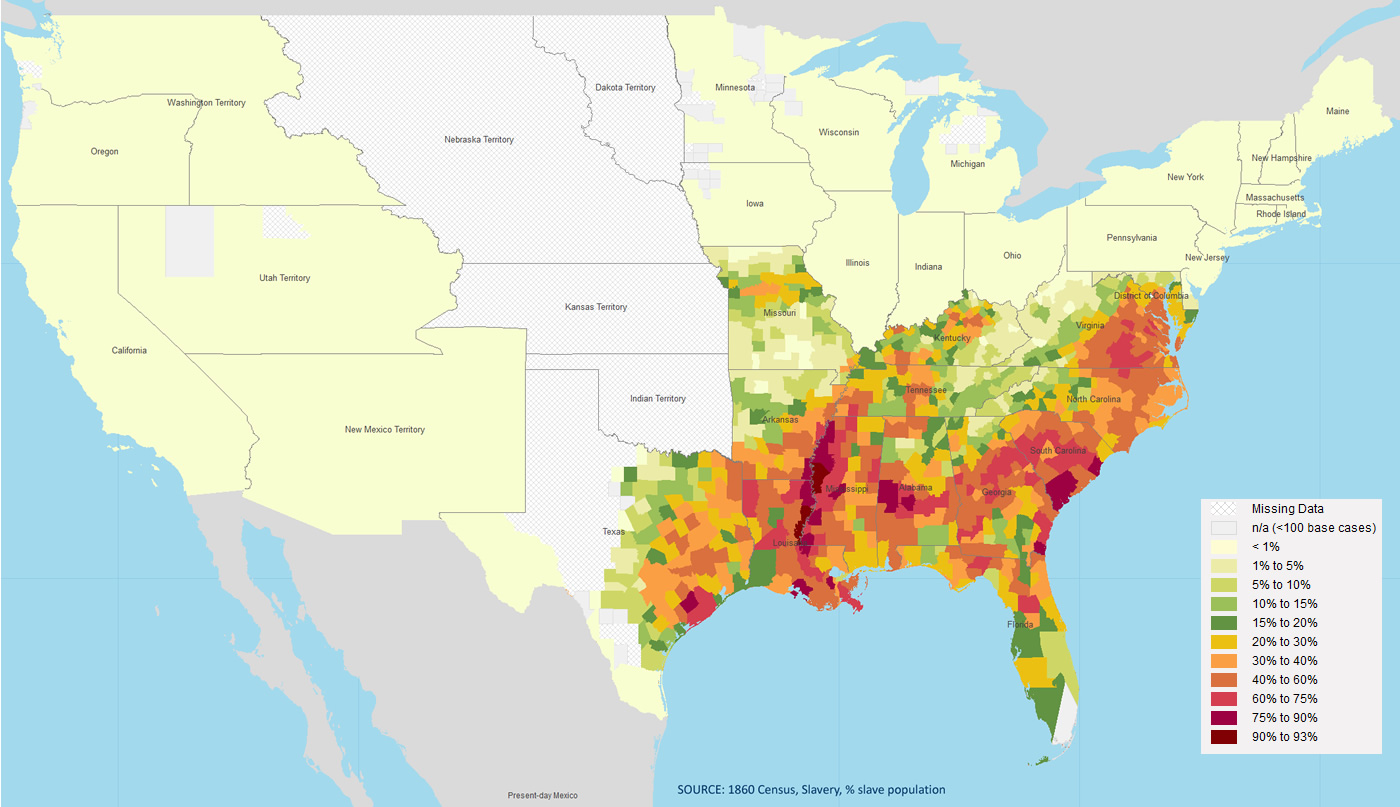
Percentage of people in slavery via a map created by SocialExplorer.com using 1860 Census data. The brighter the orange and red, the higher density of enslaved people.
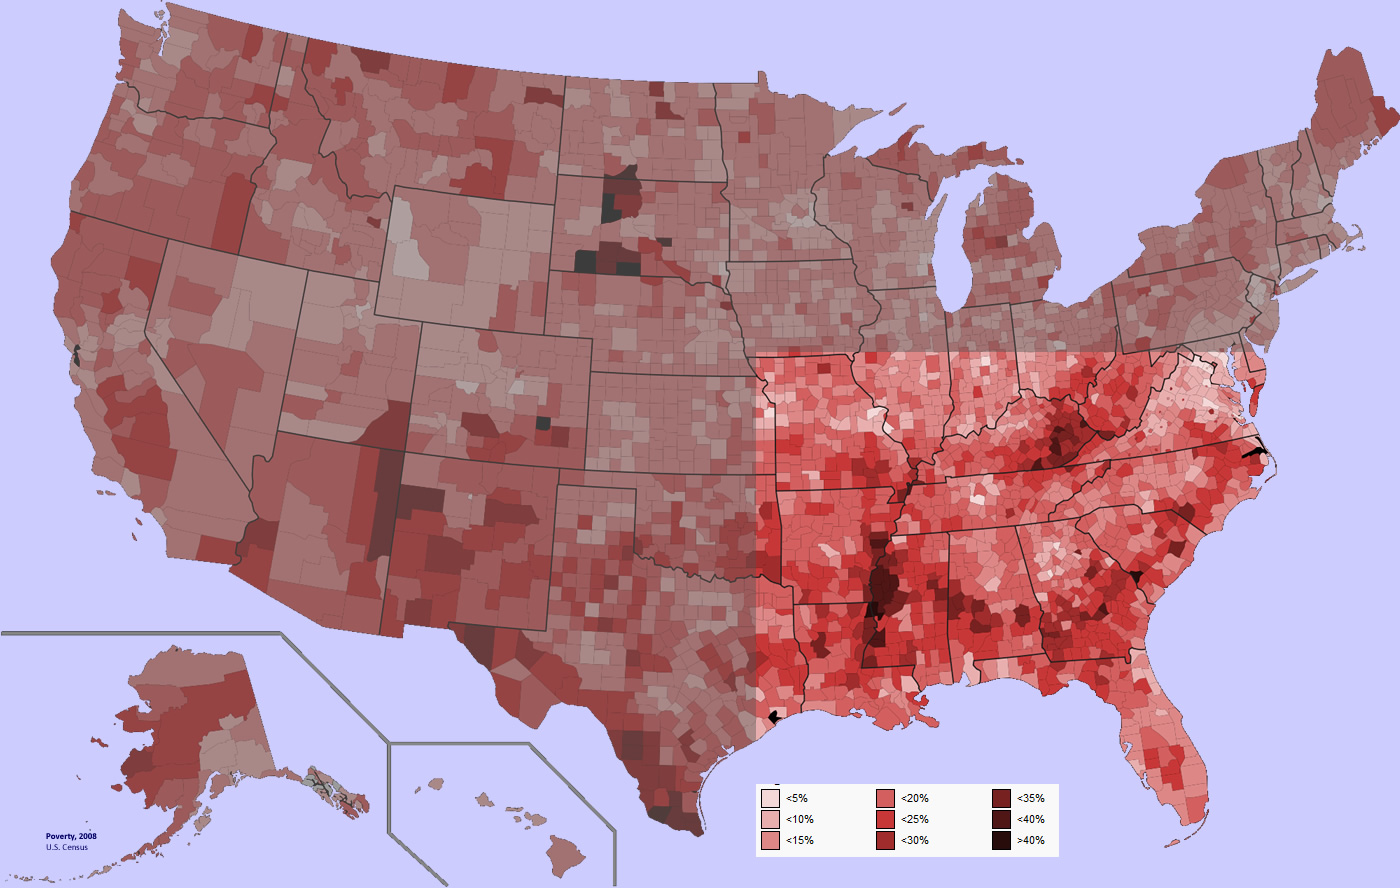
Poverty, 2008
Source: U.S. Census, 2008, via Wikipedia
For earlier news stories and commentaries, please see our news archives prior to 2011.